
|
|
|
Further information about the course, as well as the application forms, can be found at: www.ioccg.org/training/SLS_2014.html. The deadline for applications is 14 March 2014.
A significant outcome of the recent IOCCG International Ocean Colour Science (IOCS) meeting was a number of recommendations from the various splinter sessions for follow up workshops. The first of these is a workshop on Ocean Colour System Vicarious Calibration for Science and Operational Missions, based on a recommendation from the IOCS Vicarious Calibration splinter session and proposed jointly by Ewa Kwiatkowska (EUMETSAT), Giuseppe Zibordi (JRC, EU), Jeremy Werdell (NASA GSFC), Bojan Bojkov (ESA) and Menghua Wang (NOAA). The workshop will be sponsored by the IOCCG, and is scheduled to take place at ESA/ESRIN, Italy from 2-3 December 2013, immediately following the Sentinel-3 Validation Team meeting. The workshop is intended to gather experts actively working on vicarious calibration and space sensor calibration to discuss details of the methodology, implementation, measurement sources and accuracies, protocols, operational mission needs, standardization, future requirements and potential solutions. It is anticipated that the outcome of the workshop will be the publication of guidelines and recommendations in the form of a position paper. A number of other proposals for follow-up workshops have been submitted to the IOCCG. Many of these workshops are scheduled to take place next year - further details will be provided closer to the time.
The 19th IOCCG Committee meeting will be hosted by the Council for Scientific and Industrial Research (CSIR) and the South African National Space Agency (SANSA), and will take place in Cape Town, South Africa from 28-30 January 2014. A number of important issues will be addressed during the meeting, including implementation of the CEOS Ocean Colour Radiometry-Virtual Constellation (OCR-VC), a review of recommendations from the International Ocean Colour Science meeting, making plans for the second IOCS meeting, status of the various IOCCG scientific working groups, and arrangements for the 2014 IOCCG Summer Lecture Series. At the end of the meeting, the IOCCG Chairmanship will be transferred from David Antoine (LOV, France), who has chaired the IOCCG Committee since 2010 with the utmost dedication and professionalism, to Stewart Bernard (CSIR, South Africa), who is warmly welcomed.
NASA's Earth Observatory recent feature article shows how the 2012 map of the Earth at night, produced using data from VIIRS on the Suomi NPP satellite, found a city of lights in the middle of the South Atlantic Ocean, about 300 to 500 kilometers offshore. These lights were from a large number of fishing boats adorned with lights for night fishing of Illex argentinus, a species of short-finned squid that forms the second largest squid fishery on the planet. The fishery is fuelled by abundant nutrients and plankton carried on the Malvinas Current, which flows north and east along the South American coast.
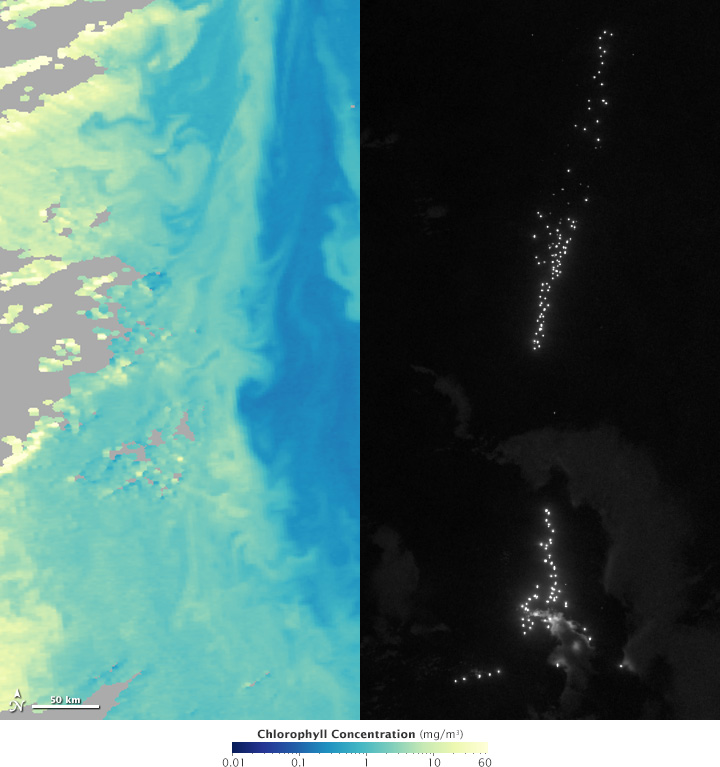 On 18-19 April 2012, daytime chl concentrations (left) and nighttime ocean lighting (right) line up in the South Atlantic (Map by NASA Earth Observatory, using data from the NASA Ocean Color Group and the VIIRS day-night band on Suomi NPP(click to enlarge). Squid aggregate in the highly productive areas along the shelf break, so fishermen light up the ocean with powerful lamps to attract the plankton and fish species that the squid feed on. The squid follow their prey toward the surface, where they are easier for fishermen to catch with jigging lines. The fishing boats hug the borders of the exclusive economic zones of Argentina and the Falkland Islands. Read the full story about these night lights in the NASA Earth Observatory feature article entitled Something Fishy in the Atlantic Night.
A training course in Detection of HABs in Southeast Asia by Remote Sensing: Operational Warning and Regional Monitoring Protocols will be offered by the Nippon Foundation/POGO AWI Center of Excellence and will take place at the University of the Philippines from 24 to 15 March 2014. The course is open to 15-20 participants from developing countries within SE Asia area. See https://sites.google.com/site/habseatraining/ for more information.
Several new positions have been added to the Employment Opportunities section of the IOCCG website including a Remote Sensing Scientist position at the Wisconsin Department of Natural Resources (USA) and two postdoctoral positions: one at the Institute of Atmospheric Sciences and Climate (ISAC), Italy and the other at the University of Wisconsin�Madison (USA). |
Systematic processing of ESA's MERIS FRS mission archive into Level 2 products is also under preparation and will be completed in the first half of 2014. The project will be using the same reprocessing configuration as for the RR MERIS 3rd reprocessing. News on MERIS data access is available at https://earth.esa.int/web/guest/news. Furthermore, as part of the NASA-ESA data sharing collaboration, NASA has completed the ingest and preliminary processing of the complete mission long MERIS FRS-300 m dataset. This data set, along with the corresponding Level-2 products that have been produced using the standard NASA processing methodologies, is available via NASA�s multi-mission browse/order/distribution web browser, along with the already available MERIS reduced resolution (RR) data set. Please note that the Level-1b full-resolution data that ESA provided to NASA was produced using an earlier version of the calibration. Rather than transferring the entire Level-1b archive again (136 terabytes), NASA is working on a method of updating the calibration as part of their anticipated reprocessing of all the data sets that they support early next year.
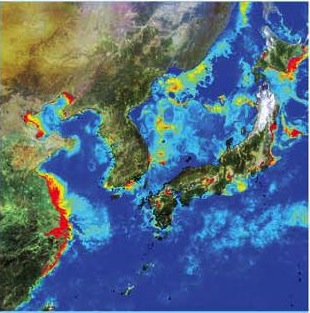
This past summer, the fishing industry in South Korea was severely damaged by large scale red tide Cochlodinium blooms that formed along the entire south and east coasts of Korea. The Korea Ocean Satellite Center (KOSC) of KIOST (Korea Institute of Ocean Science and Technology) continuously monitored and analysed satellite images from GOCI (Geostationary Ocean Color Imager) to determine the rates of transport and diffusion of the bloom. The analysis results were sent to government agencies and related organizations in an effort to mitigate the damage from the red tide bloom.
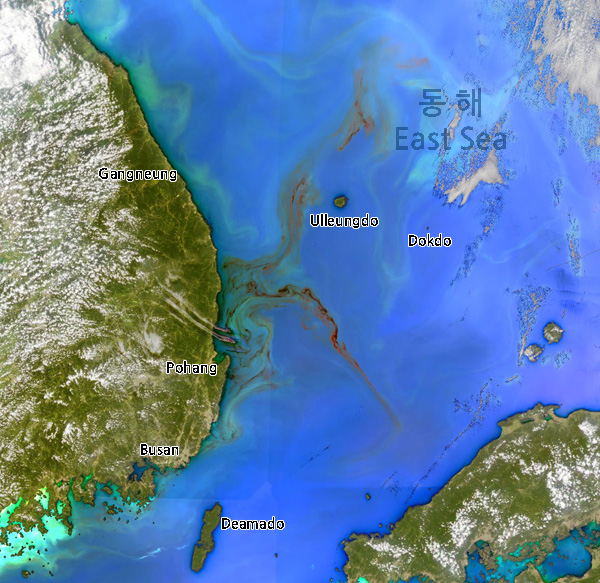 Image from red tide analyses by GOCI at 12:16:43 KST on 13 August 2013 (click to enlarge). This year, the red tide patches had low radiance values in the short wavelengths (i.e. GOCI Bands 1, 2, and 3, for the 400 - 500 nm range), and high radiance values at 680 nm due to the increased fluorescence and backscatter. For this reason, red tide patches can be detected using these spectral features. Small scale red tide blooms were first discovered on 13 July 2013 in the South Sea area and they gradually moved into the East Sea of Korea and expanded further north (up to about 39 �N) and then to the open sea near the East Sea of Korea. According to in situ data, the density of Cochlodinium reached ~7,000 cells per ml in the high concentration areas of the red tide blooms.
The Korea Ocean Satellite Center (KOSC) recently performed the 3rd Annual GOCI Validation Campaign which took place from 25 September to 03 October 2013 in the western part of the Southern Sea of Korea, and near the East China Sea. Many international and domestic research groups participated in this year�s campaign including the KOSC research team, a group from Geoinformatics Engineering at Kyungil University (South Korea), a team from NASA GSFC (USA), and a team from CNRS LOV (France).
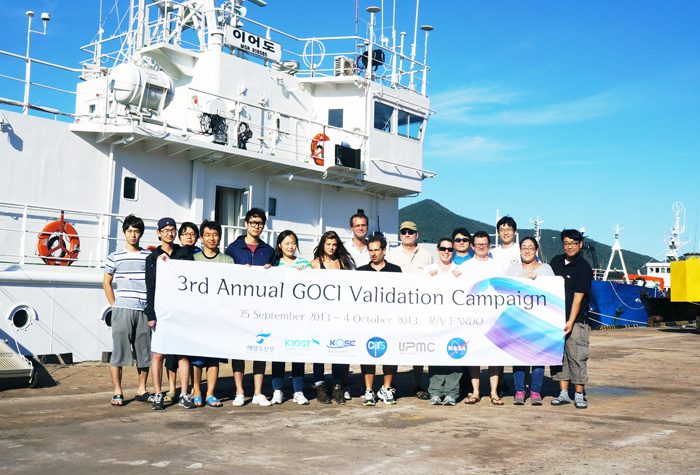
Various experiments were performed at a total of 13 sampling stations and included analysis of inherent/physical optical properties, chlorophyll and total suspended sediments concentrations, temperatures and salinities, classification of phytoplankton, primary productivity, optical properties of atmospheric aerosols etc. In-situ data will be utilized for the calibration and validation of GOCI to improve the data quality. It will also help in understanding ocean environments and optical properties of ocean water at the sampling stations.
Several new publications have been added to the IOCCG Recent References list, including a paper by Robert Brewin et al. (2013) entitled "The Ocean Colour Climate Change Initiative: III. A round-robin comparison on in-water bio-optical algorithms". The authors develop an objective methodology designed to rank the quantitative performance of a suite of bio-optical models used for mapping biogeochemically relevant variables (e.g. Chl concentration, IOPs) at global scale. The objective classification is applied using the NASA NOMAD dataset. Using in situ Rrs as input to the models, the performance of 11 semi-analytical models, five empirical chl algorithms and an empirical diffuse attenuation coefficient algorithm, is ranked for spectrally-resolved IOPs, Chl concentration and Kd(489). The sensitivity of the objective classification and the uncertainty in the ranking are tested using a Monte-Carlo approach (bootstrapping). Results indicate that the performance of the semi-analytical models varies depending on the product and wavelength of interest. For Chl retrieval, empirical algorithms perform better than semi-analytical models. See the article in Remote Sensing of Environment for full details.
Lastly, in a paper entitled "Synergy between polar-orbiting and geostationary sensors: Remote sensing of the ocean at high spatial and high temporal resolution" Quinten Vanhellemont et al. (2013) demonstrate that by synergistically combining marine reflectance data from SEVIRI, a geostationary sensor, and MODIS Aqua, a polar orbiter, the resulting product is an improvement over both data sources. The synergy approach takes the reflectance from MODIS, with high quality and high spatial resolution, and modulates this over the day by the temporal variability of the SEVIRI reflectance, normalized to the SEVIRI reflectance at the time of MODIS overpass. The temporal frequency of the synergy product is much better than that of MODIS, and by using the latter's high quality data, the limited spatial and radiometric resolution of SEVIRI is enhanced.
|
|
Material for possible inclusion in the IOCCG Newsletter should be submitted to the Project Scientist, Dr. Venetia Stuart
Subscription to the IOCCG Mailing List. Participants receive a brief summary of the IOCCG Newsletter by e-mail (quarterly), as well as hard copies of IOCCG Reports as, and when, they become available.
|
|
|
|
 Applications are now open for the
 The Plymouth Marine Laboratory (UK) will be hosting the Annual Challenger Society and RSPSoc -
 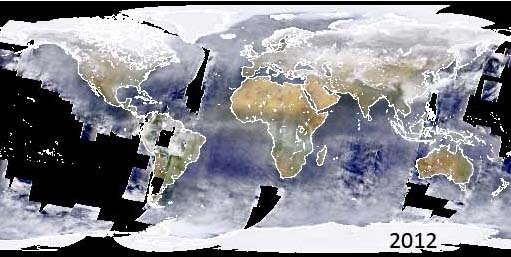 ESA has systematically processed 10 years of Envisat MERIS Level-1 Full Resolution data (FRS-300 m), covering the entire archive from May 2002 to April 2012, and they are planning to release access to the full FRS L1 dataset from a new MERCI server in autumn 2013. The complete dataset of MERIS Full Resolution (FRS) L1 data will then be freely available to the user community for direct download online, in addition to the MERIS Reduced Resolution (RR) data. The calibration has been harmonised across the full mission and is consistent with the 3rd MERIS Reduced Resolution (RR) reprocessing.
 In another new publication by